
Inspiration
This project is an exploration of the way physical borders - specifically walled borders - are represented in our minds and in digital space. In an era where every spot on earth can be located, represented, and accessed through the Internet, our physical space remains starkly disconnected and inaccessible for certain populations.
Result
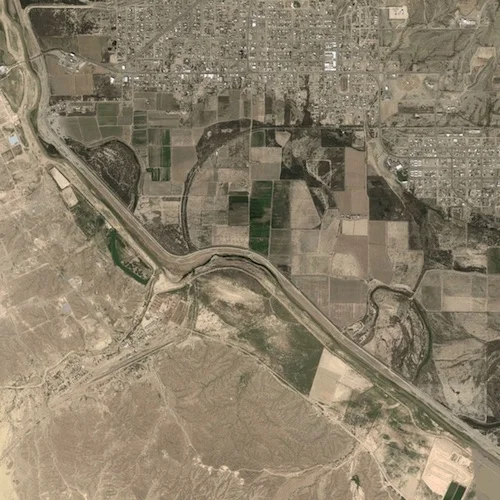
I’ve taken the satellite images of walled borders across the world (Mexico-US, Israel-Gaza, Pakistan-India) and texture mapped them into a long strip. Each border has been distorted and warped in effect to fit into a rectangular strip of pixels – each fitting into a standardized shape to be consumed, potentially, in the same way. The example above shows the border between Mexico and the United States. If you look closely, you'll spot what looks like a wall cut right through the horizontal middle of the image.
Tools: Ruby, OpenFrameworks, Processing, Projectors, Unix, Javascript, HTML
Year: 2016
Link: Github
Role: Solo project
Background
Peeking into the world of satellite imagery
I was really inspired by Laura Kurgan’s book Close up At a Distance. In it she describes the evolution of the Blue Marble image of the earth seen from space and how throughout the years it became a composite image of many images from space stitched together.
She writes about these images, “the photographs were true, at least in the trivial mechanical sense, and then provided a platform for something more abstract or virtual, the ‘concept’ of ‘one world’. Now it is the virtuality of the data-based constructions that seems self-evident. And their basis in remotely sensed data helps us understand what has become of truth in the era of the digital data stream… the fact that they are virtual images does not make them any less true, but it should make us pause and consider what we mean by truth.”
Process
Interpolations and texture mapping
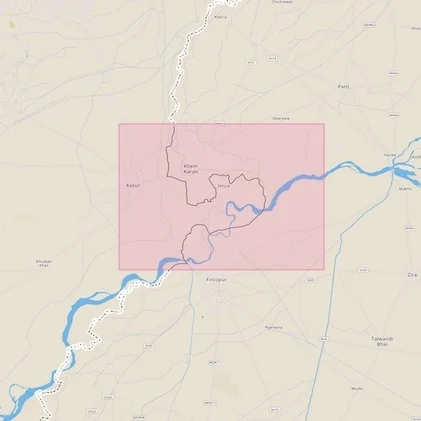
I created an application that interpolates latitude and longitude points along a border to either add points where the data is sparse (i.e. two adjacent points are too far apart to fit into a map tile) or remove points when there are too many (i.e. 2 or more points that all fit within the same map tile).
With a script I download satellite map tiles of a series of latitude and longitude coordinates. Each map tile looks something like this for a specific latitude and longitude pair and zoom level. For the picture above, that is 29.5434699 latitude, 104.3714399 longitude, and zoom level 14.
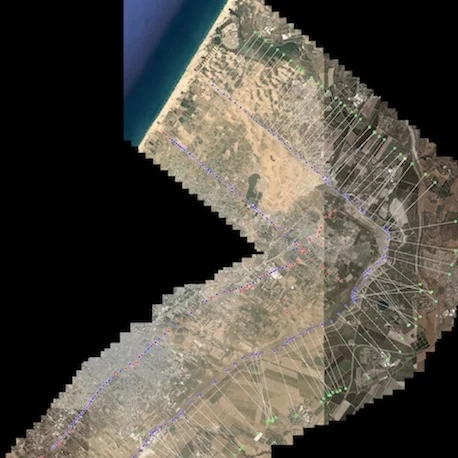
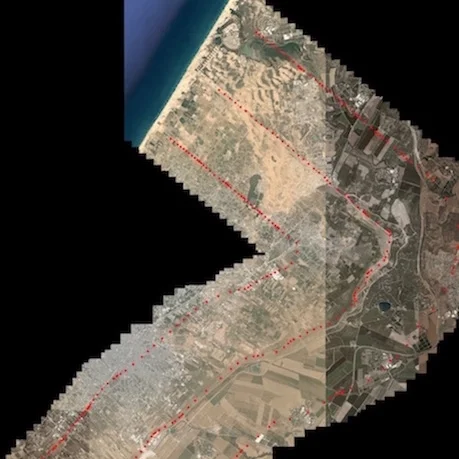
I converted spherical coordinates into pixel coordinates for each map tile and arranged them into one single image. Then I created two offset curves around the border line. Interestingly, it’s impossible to create perfect Bezier offset curves. On a first pass, approximating two Bezier offset curves creates a lot of noise (the points in red-left curve, and in green-right curve).
One has to then trim the points along the offset curves by calculating whether lines between the points intersect. Finally, these trimmed offset curves are used as the points for texture mapping.

Borders Around the World

Gallery presentation in Pittsburgh.